
Four-color MACD: what the pane is
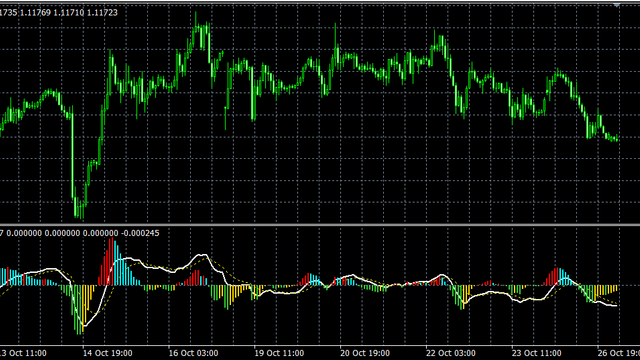
A subwindow legend. Not a buy or sell light.
Direct answer
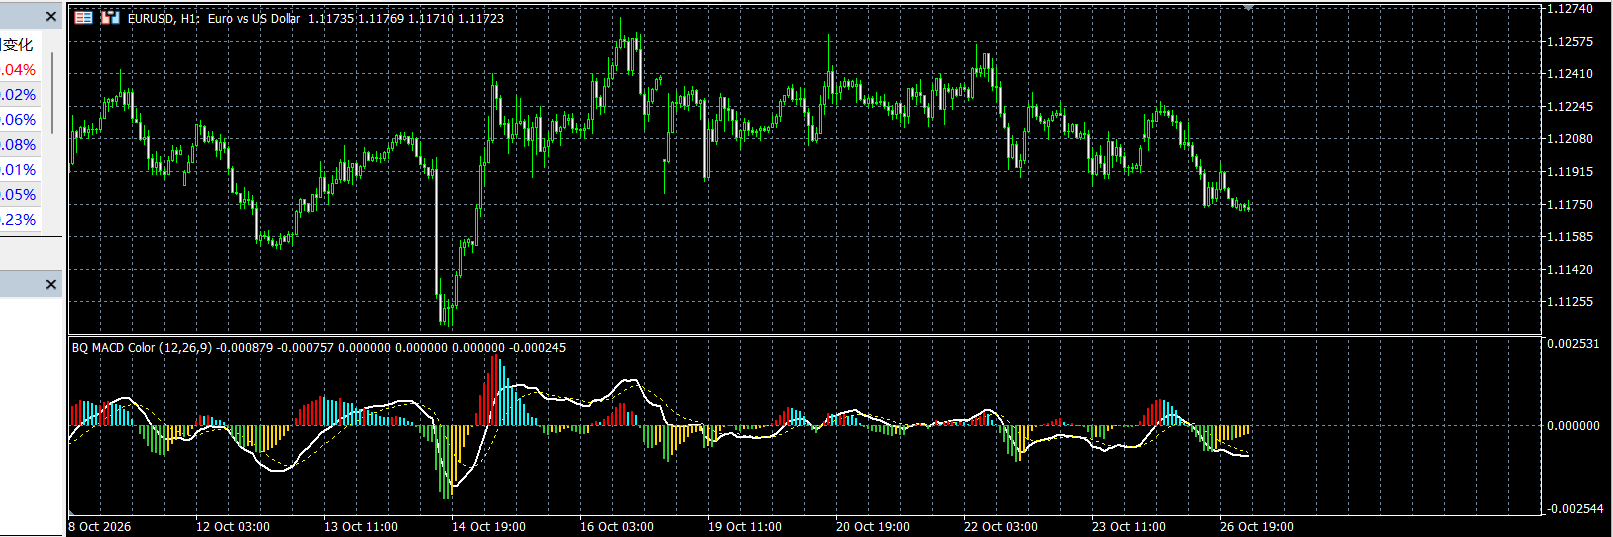
This pane is a four-color MACD histogram. Fast, slow, and signal are 12, 26, 9. The white line is DIF. The dotted yellow line is DEF. Histogram height is energy = (DIF − DEF) × 2.
The MetaTrader 5 file on this page is macd_color_lite.ex5. It needs an account. It does not place an order. It is not the divergence file.
The four colors only name two states above zero and two states below zero. They do not name the next candle.
How to compare this closed bar with the last closed bar is already written: after the close, longer or shorter. This page does not repeat that lesson.
The four colors
Above zero (bullish energy):
- Red — this closed bar is longer than the previous bullish bar
- Aqua — this closed bar is shorter
Below zero (bearish energy):
- Green — this closed bar is longer (more negative)
- Gold — this closed bar is shorter
A one-color histogram still lengthens and shortens. Four colors are a legend for the same comparison. TradingView pages often use lime and maroon, and they often treat a bright bar as an entry. That is a different product. This pane uses red, aqua, green, and gold. Nothing in that list is an order.
On a quiet, two-sided day the colors still flip. That is noise winning the last-bar comparison, not a new trend. Do less work those days.
Screenshots
Two captures from 2026-10-27. Different hosts. Different feeds. Do not stack them into one bar.
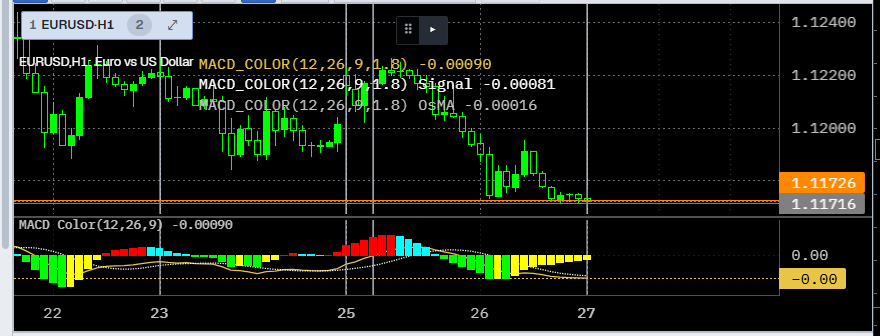
The Desktop sitting was a practice replay parked at the end of that window. End-bar readings on that capture: DIF −0.00090, signal −0.00081, OsMA −0.00016. Fast, slow, and signal are 12, 26, and 9. Do not match −0.00016 to the 0.000198 / 0.000100 pair.
On the desk
BarionQuant Desktop’s built-in MACD Color pane is this four-color MACD. The MACD pane starts at Standard. Free seats have MA and RSI, on H1 and daily. If you are on Free, take the color table from this page. Free has no MACD subwindow.
We ship Windows today. No Mac build. No browser replay.
On 2026-10-29 the free MetaTrader 5 listing BarionQuant Macd Histogram 4 Color was live at mql5.com/en/market/product/182939 (https://www.mql5.com/en/market/product/182939). The page calls it an indicator only, with no trading logic. Same brand name, two different products — that cut is already public for tools that can send live orders. This histogram does not send them. The Desktop installer does not ship that Market file.
This page attaches macd_color_lite.ex5. It does not attach an Expert Advisor or the divergence file. The divergence file is on strict MACD divergence.
Who should skip
Skip this page if you want buy and sell arrows, or a script that places orders.
Skip it if you came for the closed-bar comparison. That is the other note.
Skip it if the pane is only real to you when a Free seat shows MACD.
Next step
Download the Windows build if you want a local desk. Read why a finished chart still lies before you trust a pane you already scrolled.
For study and simulated practice only. This is not investment advice.
Educational content. BarionQuant is not a broker and does not provide investment advice or trade signals. Past practice results do not predict future outcomes.
Related reading

After the close, is the bar getting longer or shorter
6 min
After a closed MACD bar, longer means pressure is building and shorter means it is fading. Four colors name those states. Not a buy or sell script.
Same brand name. Two different products.
5 min
Same brand name on MQL5 Market and on the website does not mean the same product. One layer can fire live orders. The other is a local training desk.